Forex Winners | Free Download Downlod free trading sysrems , indicators and forex E-books

A triangle is a corrective chart pattern where the price moves in between two converging trendlines. Trendlines are used to identify the triangles, and depending on the slope, triangles can be classified as: symmetrical, ascending and descending.
A triangle is completed by a break of the upper or lower trendline as the price approaches the tip of the triangle. The resulting breakout is considered a trade signal.
Symmetrical Triangle
The symmetrical triangle is a type of continuation pattern formed when the price consolidates, forming equally converging support and resistance lines, and then resumes the initial trend.
When the price is ranging and narrows towards the right, trendlines can be applied on the swing highs and swing lows to show the converging support and resistance lines.
The support line is going up while the resistance line is going down. A break in the direction of the trend is considered a trade signal.
From an uptrend move, the price consolidates and forms the triangle. A break of the resistance line is a buy trade signal.

From a downtrend, the triangle looks similar, only that the price is coming from a downward move. A break of the support line is a sell trade signal.
Although symmetrical triangles are mainly considered to be continuation patterns, a break towards the opposite trend direction is considered a reversal.

Ascending Triangle
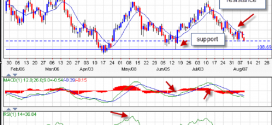
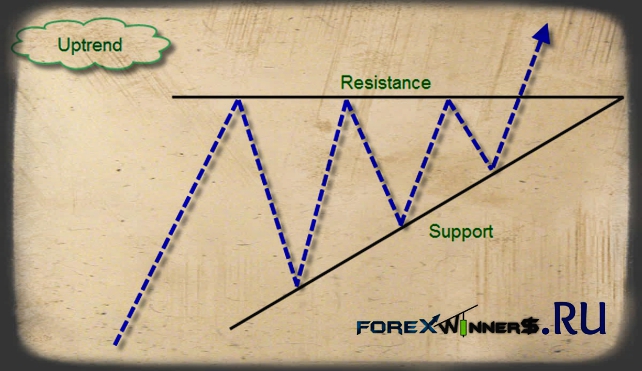
The ascending triangle is formed when the upper trendline is a horizontal resistance line and the lower trendline is an ascending support line.
It is considered a bullish pattern since the price is expected to break above the resistance line and go up.
It is also considered a continuation pattern because it’s mostly found in an uptrend. But, it can also appear in a downtrend, in which case, a break of the resistance line becomes a reversal pattern.
Descending Triangle
Opposite to the ascending triangle pattern, the descending triangle is formed when the upper trendline is a descending resistance line and the lower trendline is a horizontal support line.
It is considered a bearish pattern since the price is expected to break below the support line and go down.
Usually originating from an uptrend, the descending triangle is a continuation pattern. However, if it appears in an uptrend, a break of the support line is a reversal signal.

Edited by Mr Alex Michel from UK.