 Forex Winners | Free Download Downlod free trading sysrems , indicators and forex E-books
Technical analysis is the study of historical prices that help a trader forecast future price movements. There are several different ways to look at historical price movements including evaluating patterns, looking at averages, as well as evaluating studies. When a trader analyzes price movements in forex trading they will occasionally look at overlays and indicators.
What is the Difference Between and Overlay and an Indicator?
A study that uses the same scale as prices are typically plotted on top of the price bars and are therefore are called overlays. A study that uses prices but is evaluated using a different scale is often called indicators. The only difference is the scale as it is easy to see one scale in conjunction with the price and another separately.
Moving Average Crossover and Stochastic Oscillator
Two commonly used trading studies are the moving average crossover and the stochastic oscillator. The moving average crossover is an overlay and provides information about a trend. The stochastic oscillator provides information about momentum as well as overbought and oversold levels.
The moving average is the average of the price of an asset, over a specific period. The two shown in the chart of Gold are the 10-day moving average and the 50-day moving average. Since the moving average is a reflection of price and is shown as a price, it can be overlayed over the historical and current prices when it is evaluated in a chart. The fast stochastic on the other hand is an index that is calculated by using the price of gold. The index fluctuates between 1 and 100 and therefore is on a different scale.
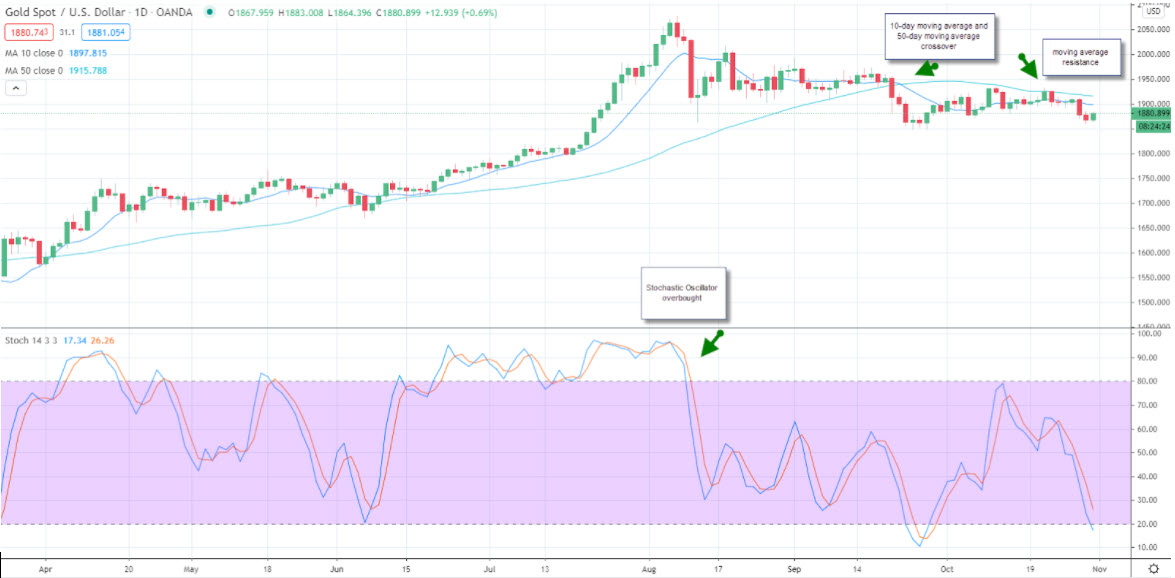
For example, in the chart of gold, the 10-day moving average is at $1,897 when gold is trading in October of 2020 at $1,880. This compares to the fast stochastic which is near 20 in late October and was as high as 80 in mid-October. The scale of $1,880 and 20 would not be able to fit on a chart which is why the fast stochastic is shown below on a different scale.
How Do You Use Moving Averages?
You can use a moving average as an overlay, to evaluate trends as well as support and resistance levels. A moving average is the average of a certain number of periods. For example, the 10-day moving average is the average of the last 10-days. On day 11, the first day is dropped from the calculation. When a shorter-term moving average, like the 10-day moving average crosses above a longer-term moving average, such as the 50-day moving average, it signifies that an uptrend is in place. The reverse is true when the 10-day moving average crosses below the 50-day moving average. If you plan on creating a trend following a trading strategy, moving averages will be helpful in this process. Additionally, you can use a moving average to define levels of support, and levels of resistance.
How Do You Use Stochastics?
A stochastic measures the price changes over a specific number of periods. There are two popular ways to use the fast stochastic. When it generates a crossover sell or buy signal, momentum is accelerating in the direction of the crossover. A second way the fast stochastic is often used is as a mean-reverting indicator. When the fast stochastic prints a reading above 80, the price of the asset it is following is considered overbought. When the fast stochastic reaches an index reading of 20 or below the asset it is following is considered oversold.
Summary
An overlay is a study that uses the same scale as price, while an indicator often uses a different scale. Both an overlay and indicator can be used to generate trading strategies and help you evaluate a chart of historical prices to determine the future direction of an asset.
