Forex Winners | Free Download Downlod free trading sysrems , indicators and forex E-books
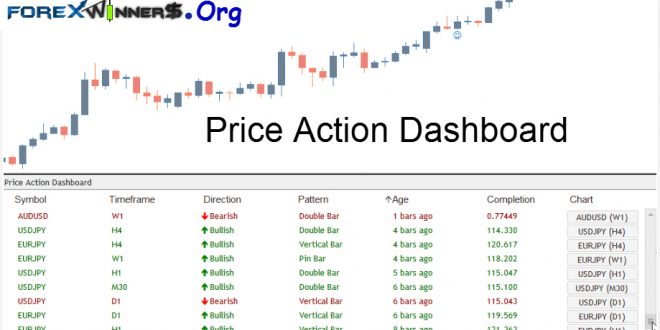
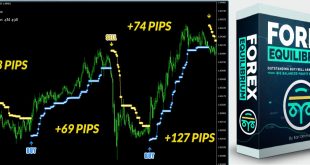
Price Action Dashboard Indicator-powerful price action patterns
By // indicatorvaulthq.com/pad/
The name says it all. This “Price Action Dashboard” scans all currency pairs and all time-frames for 5 powerful price action patterns that have the greatest probability of winning:
Pin Bar, Double Bar High Lower Close, Double Bar Low Higher Close, Bearish Outside Vertical Bar, and Bullish Outside Vertical Bar.
With just one look at the dashboard, you’ll instantly know all the information you need to make a good trading decision. You’ll instantly know which pattern appears on every time-frame (from 1-minute to monthly) and on every currency pair.
Not only that, you’ll also know the exact direction of that pattern – whether it’s bullish or bearish. And you’ll know exactly how long ago that particular pattern showed up.
Remember, you can specify as many pairs as you like. You can also use it for indices, stocks, futures, and gold (anything your broker offers in Metatrader). Our Price Action Dashboard takes care of it all.
Let me show you a short clip where I scroll through 20 currency pairs (and all time-frames from 1-minute to monthly) and see all the patterns on my dashboard.
And you’re in total control. You can specify which currency pairs and which time-frame you want the indicator to scan for Price Action patterns.