Forex Winners | Free Download Downlod free trading sysrems , indicators and forex E-books
Here is where things get crazy!
Not really, actually this is the simplest part of the entire method. Albert Einstein once said “Make things as simple as possible, but not simpler”, and to that end, here is a good way to identifying if a market is in a trend.
Use two Exponential Moving Averages:
21 EMA
55 EMA
When the 21 EMA is over the 55 EMA, the trend is up.
When the 21 EMA is under the 55 EMA, the trend is down.
This definition of a trend is an oversimplification, but it’s where we start.
Keeping my charts clean is important to me, and adding the additional moving averages can make things a little more cluttered than I usually like to see.
For this reason, I color the 21 and 55 EMA’s a grey color so they blend into the white background of my charts to some degree. On a black background, a darker grey color for the EMAs would be my preference.
Below is an example of what my chart looks like with the 21 and the 55 EMA’s.

The lighter grey color on the white chart doesn’t become overwhelming and distracting, and this is important to note. As we trade FMM, we will be taking trades that occasionally go through the lines, and other times we will be using the lines as both targets and as areas of support and resistance.
I don’t want you to become too distracted by the lines, and having them subdued is one way to keep them in the background. They are there when we need then and quiet when we don’t.
Why the 21 and 55 EMAs ?
You can experiment with other settings as you like. The 13 and 21 are common for moving averages. Over a lot of testing, I have found the 21 and the 55 to be the most reliable in determining a trend. They are slow enough that they determine when a real trend has legs, but fast enough to not lag behind the change of a trend too long.
As you look at a chart with the 21 and the 55 EMAs, you will see that both of these MA’s are extremely strong levels of dynamic support and resistance, and this element makes these great MA’s for trend following.
Price never strays too long before returning to the 21 EMA and then the 55 EMA.
This is an important aspect to counter trend trading, price moves away from the moving averages, but very quickly will return to these levels. And because of the excellent ability to provide support and resistance, these moving averages also make incredible targets.
The 21 and the 55 EMAs work on all the timeframes, from the 1 minute to the monthly. This simplifies things as well, not having to look at different MAs for different timeframes, and as you know, simple is good!
Feel free to try out your own settings, experiment with many combinations, with exponential and simple, or a combination of the two, you might find something that you feel works better for you. Either way, the following pages will show you how to use them.
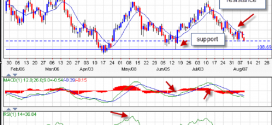
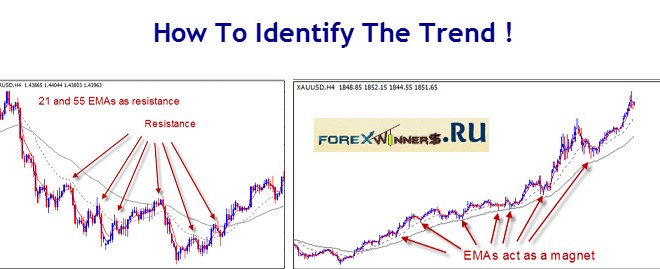
21 EMA and 55 EMA as support:

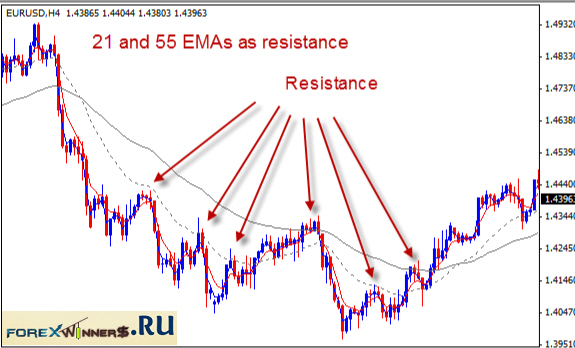
21 EMA and 55 EMA as resistance:
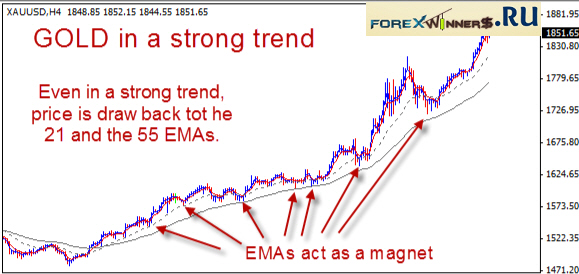
Even as the 21 and the 55 are great areas of support and resistance, they are also excellent at drawing the price back to it. This concept all on its own makes these moving averages great targets on counter trend trades.
Below is an example of Gold (AU). Lately, Gold has been on an incredible trend, and as you can clearly see, the moving averages have provided excellent support as price has been moving up, but at the same time, Gold prices have always come back to the moving averages.
Viewing the MAs as support, resistance and targets opens up a new world of trading possibilities!
Next post we will show you how to confarm and follow the trend ,,,
Edited by Alexander Ben.