Forex Winners | Free Download Downlod free trading sysrems , indicators and forex E-books
The Fibonacci sequence was discovered by Leonardo Fibonacci da Pisa. In the year 1202, he wrote a book called “Liber Abaci” which introduced the sequence to Western European mathematics. The Fibonacci sequence is a series of numbers: 0, 1, 1, 2, 3, 5, 8, 13, 21, 34, 55, 89, 144 and on to infinity.
The formula for the Fibonacci series is: Fn = F(n-1) + F(n-2) where “F” is the Fibonacci number and “n” is its order in the sequence. Except for the first two numbers, each value in the sequence is the sum of the two values before it.
Fibonacci ratios are based on the Fibonacci series. It is the mathematical relationship of a number from the sequence to any of the numbers before or after it. The Fibonacci ratios are 0%, 23.6%, 38.2%, 50%, 61.8%, 78.6% and 100%.
All the emotions that occur in the markets are within some definable limits, most of them recorded in statistical series. This is where Fibonacci comes in. In trading, Fibonacci ratios can provide probable levels of support and resistance.
A retracement is as a temporary price reversal occurring within a prevailing trend. The Fibonacci ratios are used as retracement levels that indicate probable levels of support or resistance. Each level is considered a potential area of retracement before the price continues to move in the original direction. Fibonacci retracements are displayed using horizontal lines that indicate the levels of Fibonacci ratios. You can add more levels if you want.
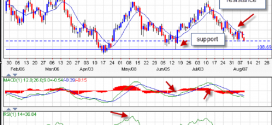
Here is an example in an uptrend. As you can see, the price retraced to the 50% level and a few times to the 38.2% level.

In my system, I have added other values to the usual Fibonacci levels. All in all, I use 0.0, 13.0, 23.6, 38.2, 41.4, 50.0, 61.8, 70.7, 78.6, 88.6, 100.0, 113, 127, 141.4, and 161.8. Each level can serve as either support or resistance levels that the price may respect or break.
In an uptrend, the Fibonacci tool is applied from the lowest low (point A) to the highest high (point B), where you can see 0.0 level at the top. It’s the opposite with a downtrend where you apply it from the highest high (point C) to the lowest low (point D), and the 0.0 level is at the bottom.

You will notice that there are two sets of numbers on the Fibonacci retracements above. The price value is the set of numbers on the left side, and the Fibonacci levels are the ones to the right.
When the price is moving in an uptrend and retraces then touches a Fibonacci level, it will most probably bounce back up. When price does this, it’s a good idea to buy. In the example, the price retraced to the 23.6 level, turned around and continued to go up.
On its way up, it breaks the upper Fibonacci level, which is the 13 level. This indicates that the price will continue to go up. However, if it goes below the 23.6 Fibonacci level, the price is more likely to continue going down until it reaches another Fibonacci level and goes back up. When the price does break that level, it’s a good idea to sell.

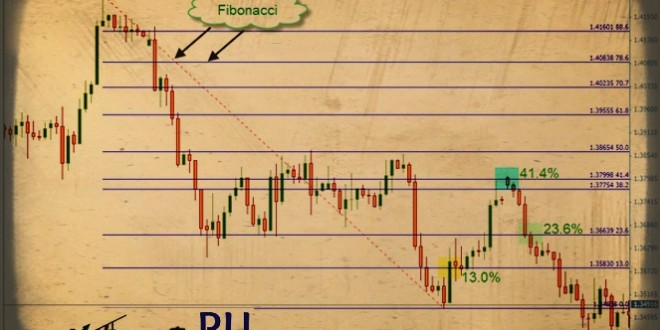
In the next example, the price exceeded the 13.0 and 23.6 levels. You can sell there and target any of the next Fibonacci levels.

The opposite applies to a downtrend.

In the example, you can see that price retraced and broke the 13.0 level; this is a buy signal. The price continued to the 41.4 level and bounced down; this is the sell signal. It kept going down and broke the 23.6 level. This is another signal to sell.
Edited by Mr Alex Michel from UK.