Forex Winners | Free Download Downlod free trading sysrems , indicators and forex E-books

EFC indicator for accurate trade entries-Find Winning Trades 2019
By // info.tradingstrategyguides.com/optin12677085
The EFC indicators can be customized to your preferred settings. This indicator works the same way on every time frame (M1-MN).It is recommended that you stick with the one time frame when you make a trade that the indicator triggered on. The entry line forms when the RSI hits a critical level and the candles turn orange (default color). Then when divergence occurs with price action and RSI dark blue candles will form (default color).
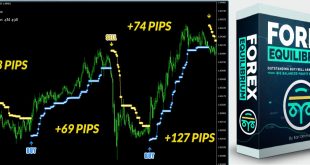
When a BUY trade is triggered the remaining candles will turn green until the set stop loss or take profit is reached. When a SELL trade is triggered the remaining candles will turn red until the set stop loss or take profit is reached. You will also see a green arrow point up (for a buy) or a red arrow pointing down (for sell). The take profit and stop loss levels are auto set to 1 risk to 3 reward ratio.
Inputs:
Range of scanning, bars: Since the indicator works in real-time mode and helps to analyze current situation, it needs some history to look in to find RSI pattern. Usually, range about 50-100 bars is completely enough to detect trade pattern.
RSI parameters:
Period: Period of standard RSI indicator, which is used for pattern recognition
Applied price: Price to which RSI indicator is applied.
Overbought/oversold levels: By default, 80/20 values are used to detect when market reached the reversal point. You can tighten the conditions and vice versa to mitigate them, if you think the market needs it.
Stop loss/take profit settings:
Stop loss margin, points: Stop loss level is calculated by using lowest colored candle (BUY trade) or highest colored candle (SELL trade) in the pattern. By default, it is placed right on the high/low value. But you can adjust it, moving the SL farther or nearer with this parameter.
Risk:Reward (1:X): Take profit is calculated automatically by stop loss distance and by this ratio. Let’s say, if your Risk:Reward ratio is 1:3 and your stop loss is 100 points, your take profit will be 100*3=300 points. Changing this parameter you can vary how many profit you’re going to have from each trade.
Drawing settings :
Draw mode: After trade signal generation EFC indicator follows an imaginary trade until take profit/stop loss is hit or new signal is generated. To visualize we’re in trade we can use several drawing styles :
-Colored bars (red for short position, green for long position) from low to high.
-Colored bars from open to close
-Bricks above/below candle
Candle width: By default bars involved into trade are painted atop of chart bars/candles with the same width, but you can change their width if you’re willing to
Lookback line/Buy signal/Sell signal/Stop loss/Take profit colors: Each type of drawings indicator makes can be adjusted to color you like.
Free Download :
User’s manual ( PDF & videos )