Forex Winners | Free Download Downlod free trading sysrems , indicators and forex E-books

A trend is the general direction of price movement. The trend can be ascending (bullish or uptrend), descending (bearish or downtrend) or flat (ranging). The names of the trends come from the way the animals attack their victims, the bull with its head bowed moves from low to high, and the bear on its feet moving from high to low.
A trend can be identified by drawing a line joining two successive highs or two successive lows. This is called a trendline. A third high or low that confirms the trendline tells us that this trendline is a valid line of support or resistance.

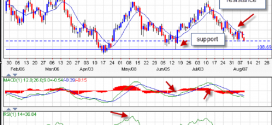
Support and resistance levels play an important role in analyzing market behaviour. Using trendlines allows us to identify these levels.
Support is the lowest maximum level that the price can reach. This is the level at which the price is unable to break any lower. As price declines, the demand from buyers increases because prices are lower, but the supply decreases because the sellers become less willing to sell at low prices.

Eventually, price reaches a level where no one is willing to sell, and demand overcomes supply. This level is the support level and is often described as a “floor” because it prevents price from going down.
Conversely, resistance is the maximum high level that price can reach. Resistance is the level that price is unable to break and rise any further. Here, the sellers are more willing to sell when prices are increasing, while buyers are less likely to buy.

Supply eventually overcomes demand and the price is unable to rise any higher. Because of this, it is often described as the “ceiling” of the price.
Support & resistance are not exact levels, and so they are often referred to as areas. Basically, when the price bounces from a support area, you get a buy signal. When price bounces from a resistance area, you get a sell signal. Support and resistance exist in ranging and trending markets, and they can be identified using the trend lines or channel lines, and the Fibonacci retracement tool.
Edited by Mr Alex Michel from UK.