Forex Winners | Free Download Downlod free trading sysrems , indicators and forex E-books
Trendlines & Channels
As mentioned earlier, a trendline is a straight line drawn over the price to connect the swing highs in a downtrend, or under the price to connect the swing lows in an uptrend, to represent the main direction of price and to identify areas of support and resistance.

Pivot points are essential in drawing trendlines. Pivot points are basically turning points referred to as reaction highs/lows, or more commonly as swing highs/lows. In a downtrend, a trendline is applied by connecting two pivot highs or swing high points (point A to point B). But in an uptrend, a trendline is applied by connecting two pivot lows or swing lows (point C to point D).

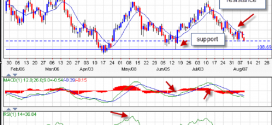
The trend remains down until the price breaks the trendline, which represents the resistance area that is preventing the price from moving higher. When the price broke above that trendline, it began to form a new uptrend.
The trend remains up until the price breaks below the up trendline, which is acting as support. Here, the trendline connecting the lows offers a support area that prevents price from going down.
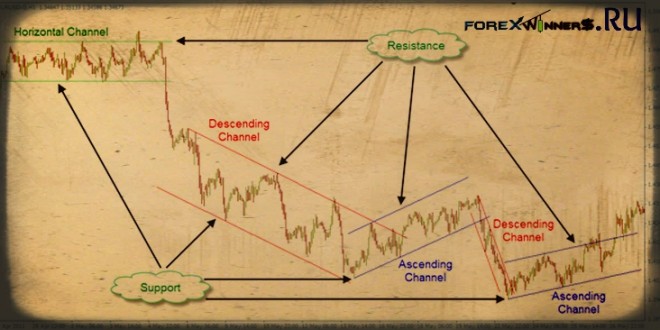
If you add a parallel trendline on the other side of the price, you will get a channel. Channel lines are always parallel to each other.

There are three types of channels. A horizontal channel represents the movement of a ranging market. A descending channel is drawn in a downtrend, and an ascending channel is for an uptrend.
Although both lines of the channel can represent potential areas of support and resistance, the superior trendline usually represents resistance, and the inferior line represents support.
If the price bounces off the inferior trendline, you get a buy signal. On the other hand, if price bounces off the superior trendline, you get a sell signal. An ideal exit would be when the price touches the opposite trendline.
Trendlines or channels don’t only help identify the trend, support and resistance areas, they also serve as confirmation to Bollinger Band signals, and are used in identifying important chart formations like flags and triangles. Drawing a trendline is useful for Price Action analyzing.
Edited by Mr Alex Michel from UK.